Table of Contents
What is Hydrograph?
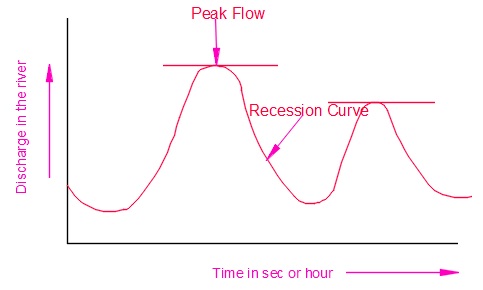
A hydrograph is a graph that shows the discharge overtime at any specific point in time. Time is shown on the x-axis and discharge is shown on the y-axis.
I have drawn a typical hydrograph. (Refer to below image)
What are the Components of the Hydrograph?
Following are the components of the hydrograph:
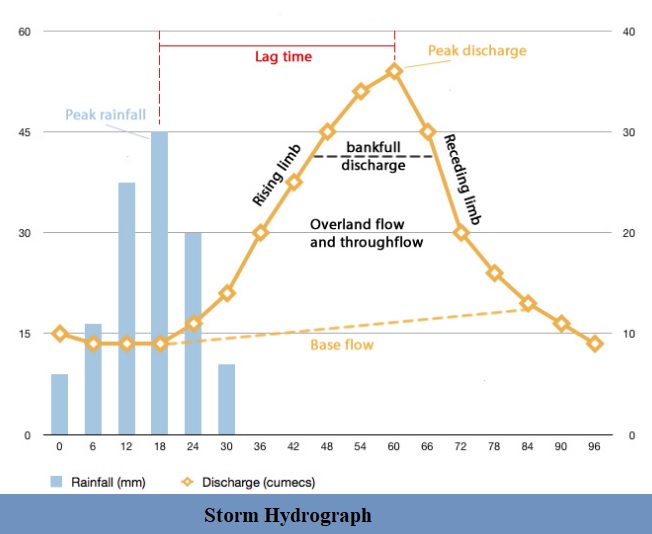
1. Rising Limb:
It shows the increase in discharge from the catchment area in response to the rainfall.
2. Falling limb or Recession Limb:
The falling limb is the extension of the graph from the peak flow rate.
3. Peak Discharge:
It is the highest point on the graph where the discharge is maximum.
4. Lag Time:
The time taken between peak rainfall and peak discharge is called lag time.
What are the Types of Hydrograph?
The following are the types of hydrographs.
- Unit Hydrograph
- Storm Hydrograph
- Snyder’s Synthetic Unit Hydrograph
- Annual Hydrograph
- Monthly Hydrograph
- Seasonal Hydrograph
- Flood Hydrograph
I have described above-mentioned types of hydrographs in brief:
1. Unit Hydrograph:
A unit hydrograph is a direct runoff hydrograph that is a result of one unit (one inch or one cm) of constant intensity uniform rainfall occurring over the entire watershed.

2. Storm Hydrograph:
It shows the relationship between rainfall and discharge in a river. See the below figure to understand the storm hydrograph.
3. Snyder’s Synthetic Unit Hydrograph:
A synthetic unit hydrograph retains all the features of the unit hydrograph but does not require rainfall-runoff data. It is derived from model and experience, and it is used to simulate basin diffusion by assessing the basin lag based on a specific method.
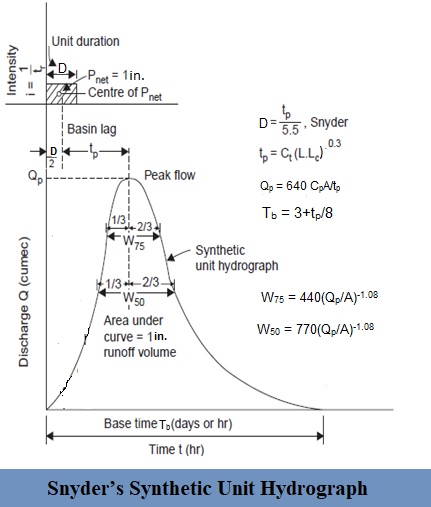
Based on the duration of rainfall it is classified as:
4. Annual Hydrograph:
It shows the variation of rainfall daily, weekly, or 10 daily mean flow over a year.
5. Monthly Hydrograph:
It represents the variation of rainfall over a month.
6. Seasonal Hydrograph:
It shows the variation of discharge in a season.
7. Flood Hydrograph:
It shows the response of drainage after a duration of rainfall.
Read More: