Table of Contents
What is the Gantt Chart?
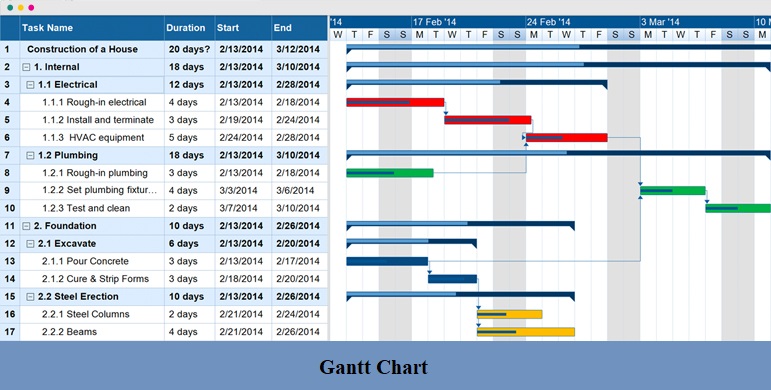
Gantt chart or Gantt diagram is a timeline bar developed by the American engineer name Henry L. Gantt between 1903-1917. This cart gives us a simple visualization of the tasks which are associated with the construction project. It is said to be one of the simplest tools used for scheduling construction projects. The start, end, and duration of tasks are defined by the bar that represented each job or activity. It can plan and schedule projects of all sizes.
Features of Gantt Chart:
The Gantt chart technique is the representation of various project tasks on the X and Y-axis. It is one of the most popular methods that is used in both small and large projects. It is one of the common scheduling techniques used in the construction industry. A person which is unfamiliar with scheduling works can easily gather information with the help of a Gantt chart.
The Gantt chart displays the following :
- Start date of the project.
- Every task of the project.
- The person who is in charge of each task.
- Duration of each task.
- Start and finish each task.
- Overlapping tasks.
- Tasks under one group.
- Linked tasks.
- Project finish date.
It is used in construction projects in circumstances like communicating the complete plan and status, monitoring the task accurately, project proposal idea, instructing the process or sequence of working, to get the idea of the tasks which are dependent on completion of the previous job.
Steps to Build a Gantt Chart:
- First, you have to determine the activities from start to end of the project. And you should identify the milestones that exist in the project.
- Then you have to find out how much time is required to complete activities and tasks. Go through it and from start to end set the tasks in order
- On a paper make a vertical and horizontal axis, on which X-axis represents time and Y-axis represents individual tasks. On Y-axis mention the milestone from top to bottom
- On this chart, each task is represented by a rectangular bar that starts from the start time and ends on the finish time of the job. If an activity that occurs at a particular time represents using a diamond at the time at which the activity happens.
Here is a tutorial video to make a Gantt chart:
Advantages of Gantt chart:
Following are the main advantages of the Gantt chart:
- Very easy representation of activities and schedule.
- It gives a very simple representation of tasks, subtasks, and every milestone on the graph.
- Planning a day, week, month, or year is very easy.
- It is very simple to represent the date and time frame.
- The team meeting is a very excellent tool for communication.
- You can view the team member on which the tasks is allotted.
- The status of a project can be viewed easily.
Want to learn about construction management, click here