Flow duration curve is a cumulative fequency curve in which dishcharge is plotted on the y-axis and percentage of time plotted on the x-axis. First, dishcharge and time is calculated. With the help of tis data, flow duration curve is plotted.
A typical flow duration curve is shown below.
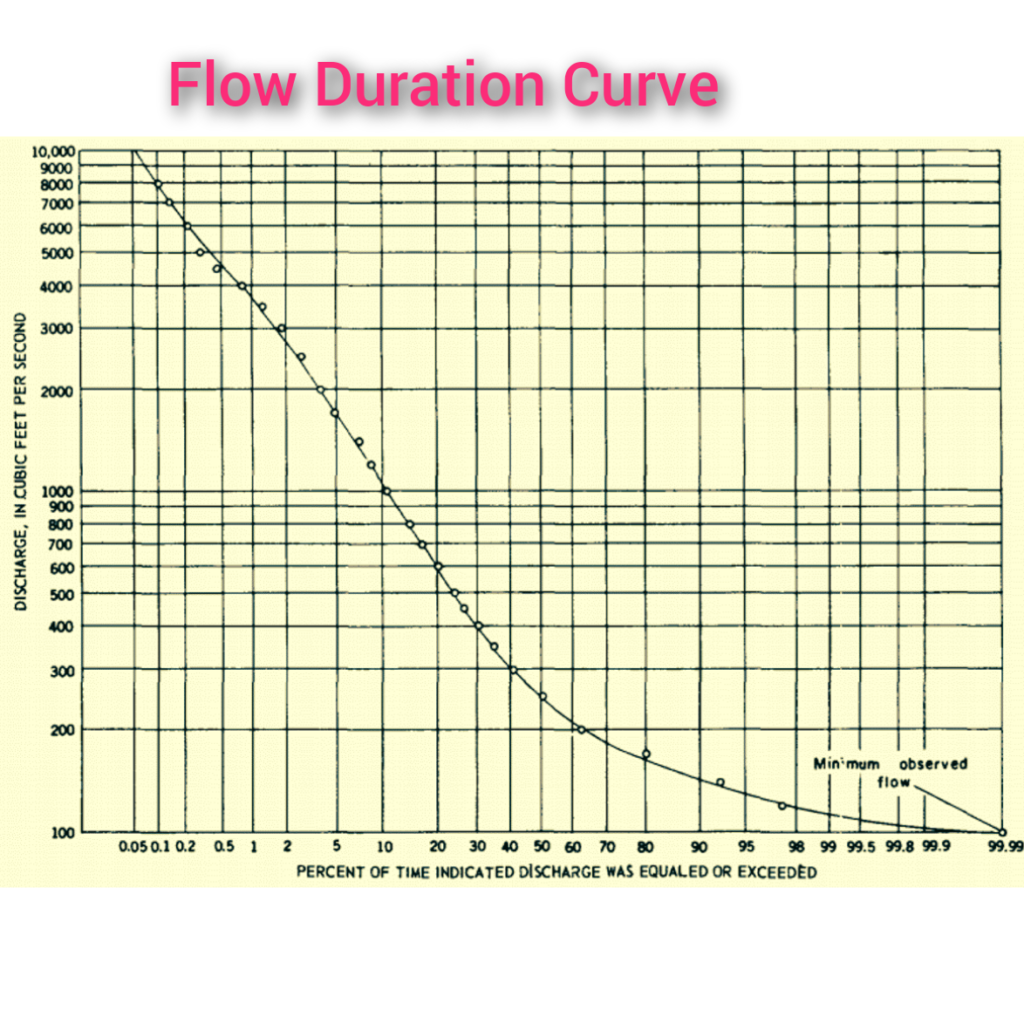
It shows the percentage of time that a particular speed has been reached or exceeded over a specific period of time. It combines the flow characteristics of the magnetic through the discharge region into a single curve, regardless of the order in which it occurs. If the time period underlying the curve represents the long-term flow of a river, the curve can be used to predict future flow distributions for hydroelectricity, water supply, and other studies. and pollution. This report shows how geological differences affect low-flow endpoints of the flow-time curves of rivers in adjacent catchments.
Therefore, time curves are useful for assessing the geological features of a river basin. A method of adjusting short-term flux duration curves to represent long-term conditions is presented. Adjustments were made by comparing the observatory’s short- and long-term records.
How to Draw Flow Duration Curve
- Calculate the total number of collected data. Lets assume it is upto N numbers.
- Rank the data in data 1,2,3,….,N.
- Calculation frequency (f)
f = total number of data (N) / rank (s) - Compute the probability of exceeding (p)
p = 1/f
p = n/N - Sort the discharges in descending order.
- Plot probability of exceedance or % of time against discharge. This curve is the FDC.
In this way you can draw the flow duration curve.
Applications of Flow Duration Curve
- Flow duration curve is used for reliable multiple flow rate evaluation in hydraulic engineering projects.
- Flow duration curve helps to evaluate low-level flows. FDC allows you to capture streams based on any percentage of the time.
- Planning and designing hydroelectric projects. Fixed capacity is calculated from hydroelectric flow curves.
- The total amount of sediment carried by a river can be determined if there is a sediment classification curve and an flow duration curve.
- Flow duration curve also provides flow variation capability. If the curve slopes continuously; this indicates that the output of the stream is very fickle. This is a typical condition where most of the flow is surface runoff.
- Used in the design of drainage systems.
- As part of flood control research.
- Used to compare Streamflow data.
- Used to calculate the sediment load and dissolved solids load of the stream.