Table of Contents
Introduction of Iron Carbon Phase Diagram
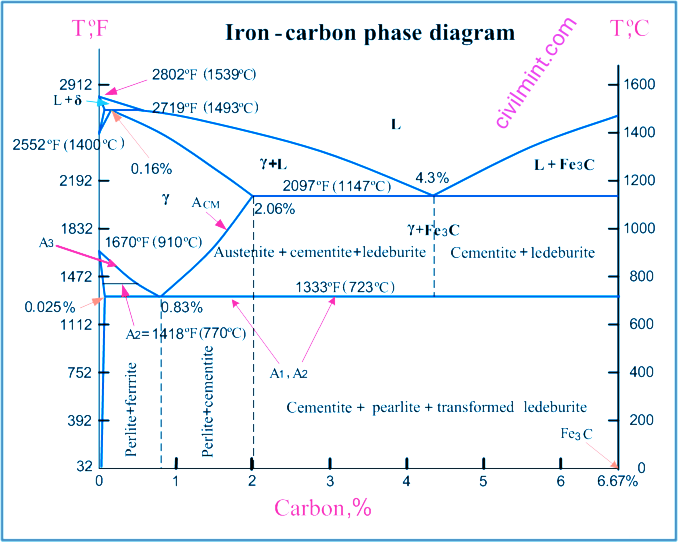
The iron carbon phase diagram represents the iron-carbon system for alloys containing up to 6.67% carbon and reveals the phase compositions and their transformations that occur in the alloy during cooling or heating.
A carbon content of 6.67% corresponds to the solid composition of iron carbide Fe3C.
Iron Carbon Phase Diagram is shown in the photo as given below:
The next phase is responsible for transformations occurring in iron-carbon alloys.
L – liquid solution of carbon in iron.
δ-ferrite – a solid solution of carbon in iron. delta-ferrite has a maximum carbon concentration of 0.09% at 2719ºF (1493ºC) – peritectic transformation temperature. The crystal structure of δ ferrite is BCC (cubic body centered).
Austenite – interstitial solid solution of carbon in gamma iron.
Austenite has an FCC (Face Centered Cubic) crystal structure, allowing high carbon solubility of up to 2.06% at 2097ºF (1147ºC). Austenite is not present below 1333ºF (723ºC) and has a maximum carbon concentration of 0.83% at this temperature.
α-Ferrite – A solid solution of carbon in α-iron. Alpha Ferrite has a BCC crystal structure and low carbon solubility, dropping to 0.025% at 1333ºF (723ºC). α-ferrite exists at room temperature.
Cementite – iron carbide, an intermetallic compound of fixed composition Fe3C. Cementite is a hard, brittle substance that affects the properties of steel and cast iron.
The following phase transformations occur in iron-carbon alloys:
Alloys containing up to 0.51% carbon begin to solidify with the formation of delta-ferrite crystals. The carbon content of delta-ferrite increases by up to 0.09% during solidification and at 2719°F (1493°C) the remaining liquid phase and delta-ferrite undergo a peritectic transformation to form austenite.
Alloys containing more than 0.51% and less than 2.06% carbon form primary austenite crystals at the onset of solidification and primary cementite stars form as the temperature approaches the ACM curve.
Iron-carbon alloys containing up to 2.06% carbon are called steels.
Alloy containing 2.06 to 6.67% carbon undergoes eutectic transformation at 2097ºF (1147ºC). The eutectic concentration of carbon is 4.3%.
In practice only hypoeutectic alloys are used. These alloys (2.06% to 4.3% carbon content) are called cast irons. When alloys in this range reach temperatures of 2097ºF (1147ºC), they contain primary austenite crystals and some liquid phase. The latter decomposes by a eutectic mechanism into a fine mixture of austenite and cementite called ledeburite.
All iron-carbon alloys (steels and cast irons) undergo a eutectoid transformation at 723°C (1333°F). The eutectoid carbon concentration is 0.83%.
When the temperature of
alloy reaches 733ºC (1333ºF), the austenite transforms to pearlite, a fine ferrite-cementite structure formed as a result of the decomposition of austenite under slow cooling conditions.
Applications of the Iron-Carbon Equilibrium Phase Diagram
For the proper study of steels and cast irons, the iron-carbon phase diagram provides an initial solid foundation. Curves provide basic knowledge about the various heat treatment processes applicable to steel. The Fe-Fe3C diagram helps us understand the compositions and properties that different alloys can have. Understanding the iron-carbon diagram is essential for material science and metallurgy aspirants.
Limitations
- The iron–iron carbide equilibrium diagram does not provide information about other metastable phases such as bainite, martensite, etc.
- Options for suppressing proeutectoid phase separation are not shown.
- The curve does not provide information on the kinetic energy, size, or precise properties of the alloy.